gdbforge — Terminal Debugger for GDB and Delve
gdbforge is a terminal debugger front-end. It puts source, the debugger console, your
program's own input and output, threads, the call stack, and breakpoints on one
keyboard-driven screen, and drives GDB or Delve underneath (-g gdb|dlv).
GDB remains the debugger. gdbforge talks to it over MI on a second UI channel
(new-ui mi2), so the source view and the list panes follow every stop automatically
while :b gdb stays a normal, fully interactive GDB console.
Install First debugging session User guide
Watch it work
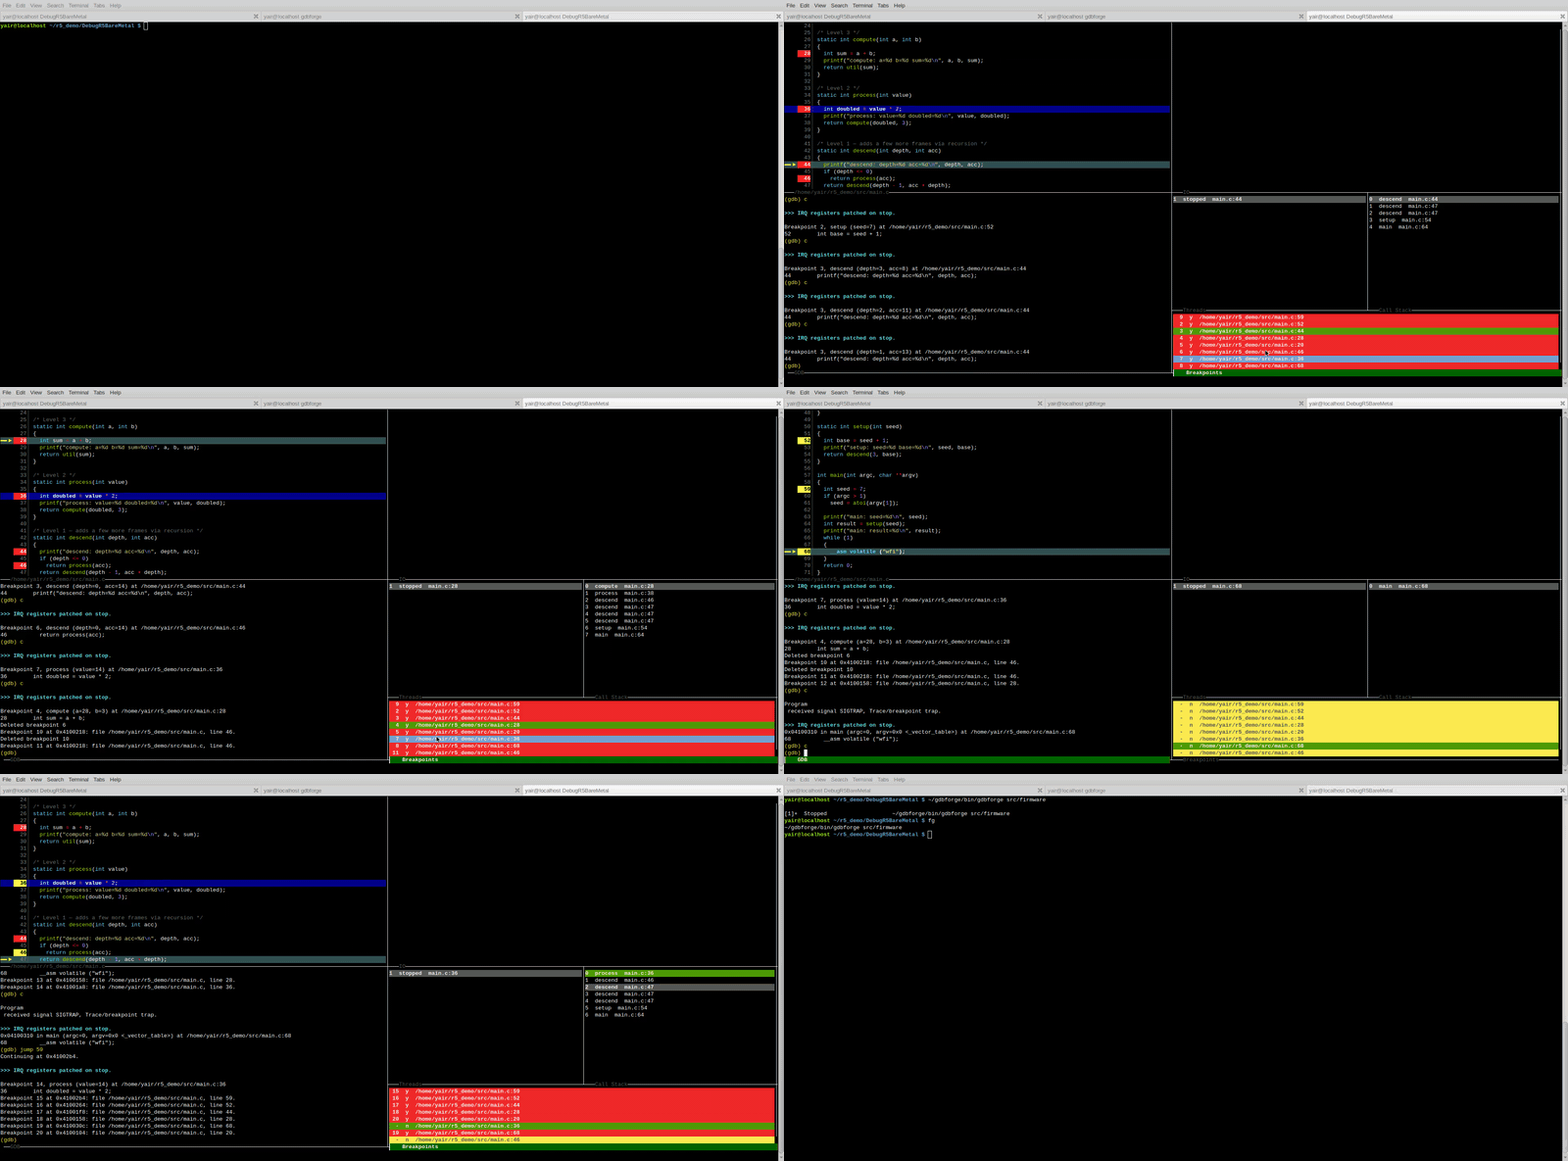
Cortex-R5 bare-metal firmware over J-Link — gdbforge brings up the probe with one Lua
command (:lua r5_baremetal_jlink spawns JLinkGDBServer, attaches and loads the ELF),
then steps a deep call stack with the source, call stack, and breakpoint panes updating
together.
Watch on YouTube ·
Zynq MPSoC guide ·
samples: examples/stack_demo.c (bare metal),
examples/zephyr_cortex_r5/ (Zephyr, thread-aware) ·
more demos below
What you get
- One screen, many panes — source, GDB/Delve console, program I/O, threads, call
stack, breakpoints, assembly. Named layouts (
:layout wide,panels,classic) and a recursive split tree (:vs,:split). - A real GDB console —
:b gdbis the genuine GDB session. Anything you know how to type into GDB still works. - Program output that does not fight the debugger — the inferior's stdin/stdout gets
its own
:b iopane, or a real external terminal for curses/TUI programs (:set inferior-tty). - Vim-style interaction — normal/insert/command/search modes, a
:command line with Tab completion,Ctrl-Wfocus chords, mouse and clipboard selection. - Breakpoints that persist — Space toggles one on the cursor line; they are saved to
./.gdbforge/breakpoints.yamland restored next session. - Lua automation for target bring-up — one
:luacommand starts OpenOCD, a J-Link GDB server,gdbserverover SSH, or kgdb, then attaches. - Go programs too — the same UI over Delve with
-g dlv.
Supported workflows
| You want to debug | gdbforge gives you | Guide |
|---|---|---|
| A Linux application on your own machine | gdbforge ./prog; output in :b io or an external terminal |
Linux applications |
| An application on a remote or embedded Linux board | :lua remotegdb — scp the binary, start gdbserver over SSH, target remote |
Linux applications |
| STM32 firmware — bare-metal, Zephyr, or FreeRTOS | :lua nucleo_f429zi — ST-Link + OpenOCD or J-Link over SWD, stop at main |
STM32 and Zephyr |
| Zynq UltraScale+ MPSoC Cortex-A53 / Cortex-R5 | :lua r5_baremetal_jlink — J-Link GDB Server or OpenOCD + Digilent HS2 |
Zynq MPSoC |
| The Linux kernel or a loadable module | :lua kgdb_uart — kgdb over one UART with kdmx, two UARTs, or Ethernet |
Kernel and kgdb |
| A Go program, including one with its own TUI | gdbforge -g dlv ./prog, :lua dlv_ext_port for a separate terminal |
FAQ — Go and Delve |
Probe and transport support comes from OpenOCD, the J-Link GDB Server, or gdbserver.
gdbforge orchestrates those tools rather than implementing its own probe driver.
Install
Requirements: Linux or macOS with a UTF-8 terminal, and gdb (or dlv for Go) on
your PATH. The hello-world below also needs gcc.
Prebuilt binaries are published for Linux and macOS on amd64 and arm64. Replace
the version with the latest release
and pick the file matching your platform.
VERSION=v1.3.0
OS=linux          # or: darwin
ARCH=amd64        # or: arm64

curl -fL -o gdbforge \
  "https://github.com/yairgd/gdbforge/releases/download/${VERSION}/gdbforge-${VERSION}-${OS}-${ARCH}"
chmod +x gdbforge
sudo mv gdbforge /usr/local/bin/
Each binary ships a matching .sha256 file:
Installs into $(go env GOPATH)/bin. Binaries built this way report their version as
dev, because the version string is stamped at release build time.
git clone https://github.com/yairgd/gdbforge.git
cd gdbforge
go build -o bin/gdbforge ./cmd/gdbforge
Building requires the Go version in go.mod
or newer. Use this if you want to edit the bundled
Lua workflow scripts locally.
The Lua workflow catalog and the helper shell scripts (gdbforge --list-scripts) are
embedded in the binary, so :lua r5_baremetal_jlink, :lua remotegdb, :lua kgdb_uart
and the rest work from any of the three installs — no checkout required. Project-local
scripts in ./.gdbforge/lua/ override the embedded ones when you want to customise a
workflow (details).
Check the install:
Your first debugging session
Build a program with debug symbols and open it:
cat > hello.c <<'EOF'
#include <stdio.h>

static int add(int a, int b) { return a + b; }

int main(void) {
    int sum = add(2, 3);
    printf("hello, gdbforge: %d\n", sum);
    return 0;
}
EOF

gcc -O0 -g -o hello hello.c
gdbforge ./hello
gdbforge opens with the source pane and the GDB console (:b gdb) alongside it. From
there:
- Set a breakpoint. Move the cursor to the
int sum = add(2, 3);line with the arrow keys and press Space. The line gets a red marker and the breakpoint appears in the Breakpoints pane. (Equivalent: typebreak mainin:b gdb.) - Start the program. Type
:gdb run. Execution stops on your line and━━▶marks the program counter. Use:gdb run— not c — for the first start; c iscontinue, which GDB rejects until the program is running. - Step. s steps into
add, n steps over, f finishes the current frame, c continues. The Call Stack and Threads panes refresh at every stop. - Inspect. Press i to focus the GDB console and type
print sum— or any other GDB command — then Esc to return to normal mode. - See the program's output.
:b ioshows theprintfoutput in its own pane. - Get help or leave.
:helpopens the in-app manual;:quitor Ctrl-D exits.
Your breakpoints are written to ./.gdbforge/breakpoints.yaml on exit and restored the
next time you start gdbforge from the same directory.
Full key and command reference: User guide · common setup questions: FAQ.
Demos by use case
Every screencast below is a recording of a real session. The Cortex-R5 demo is at the top of this page.
Embedded and bare-metal firmware
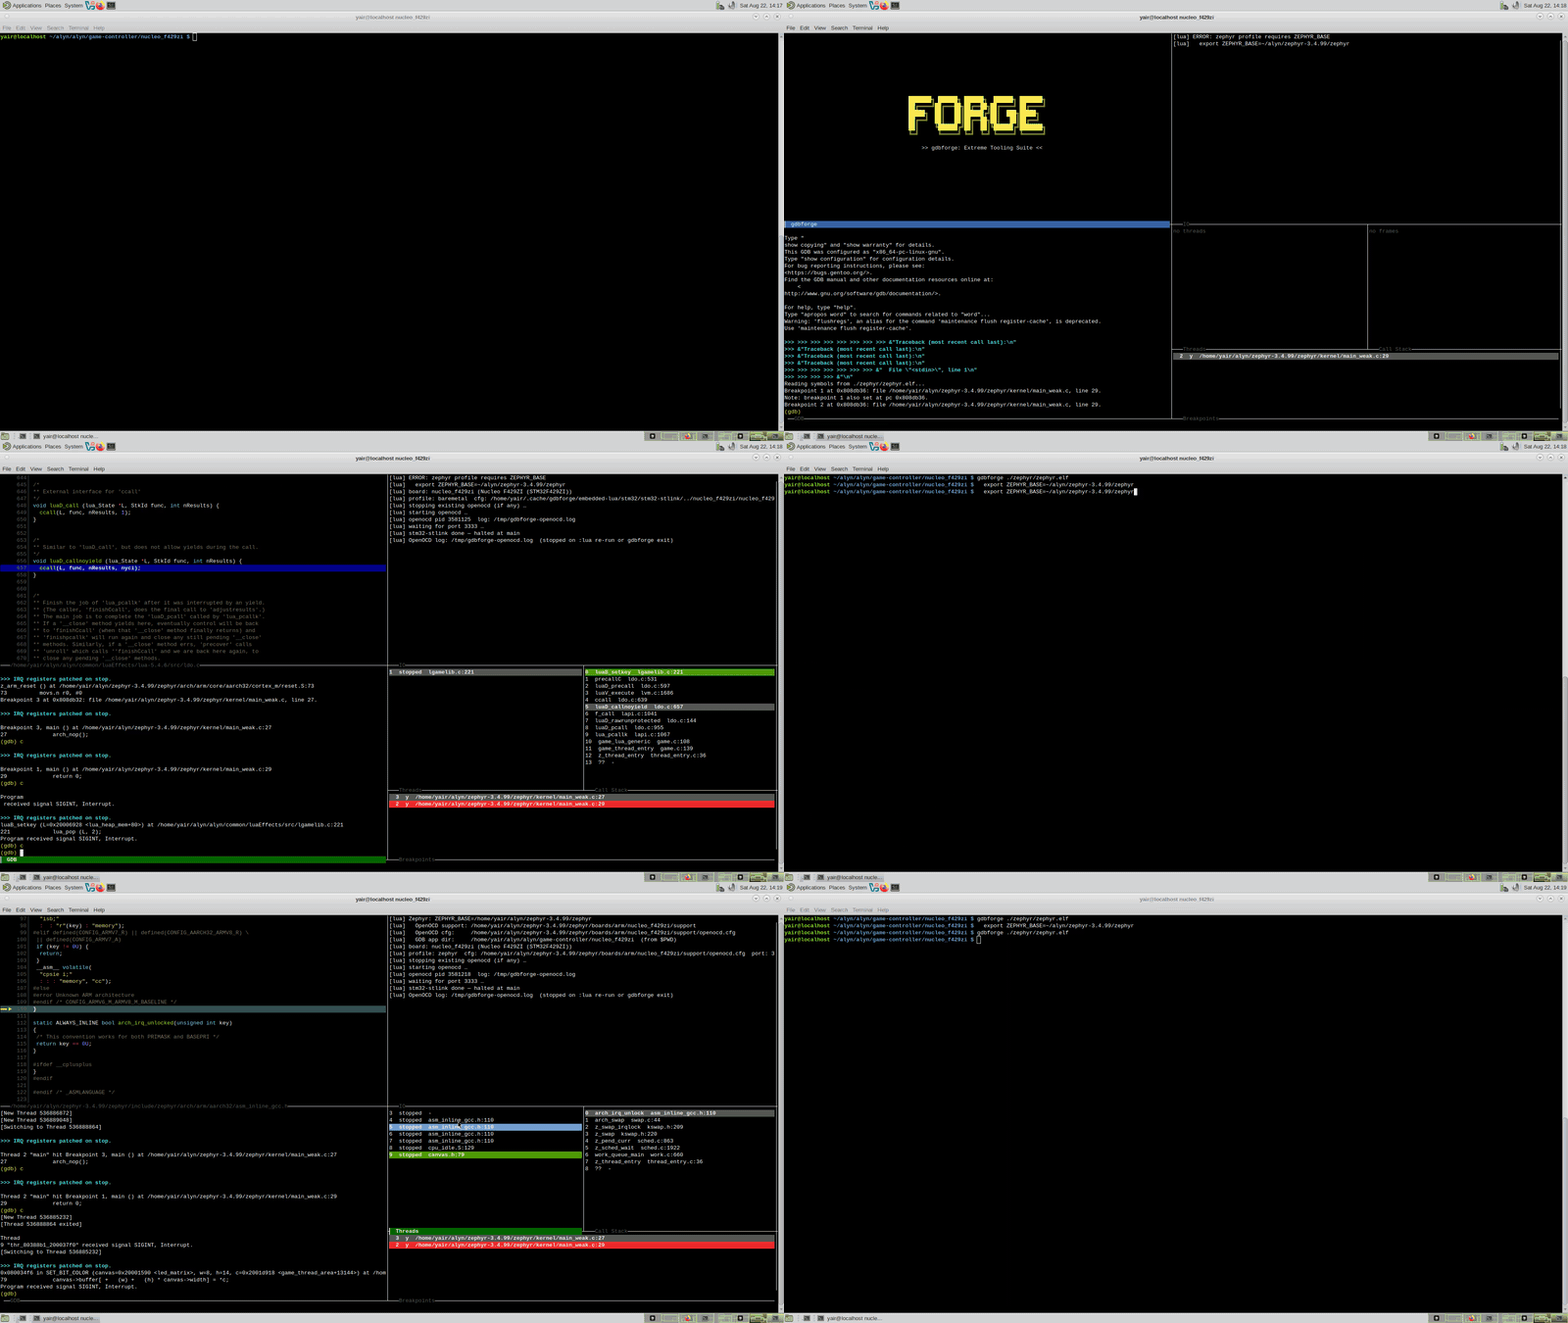
STM32 Nucleo F429ZI — bare-metal, then Zephyr-aware. :lua nucleo_f429zi baremetal
debugs the application on the board over ST-Link and OpenOCD; :lua nucleo_f429zi zephyr
re-attaches with OpenOCD's -rtos Zephyr so Zephyr threads show up in info threads and
in the Threads pane.
Watch on YouTube ·
STM32 and Zephyr guide
Linux applications
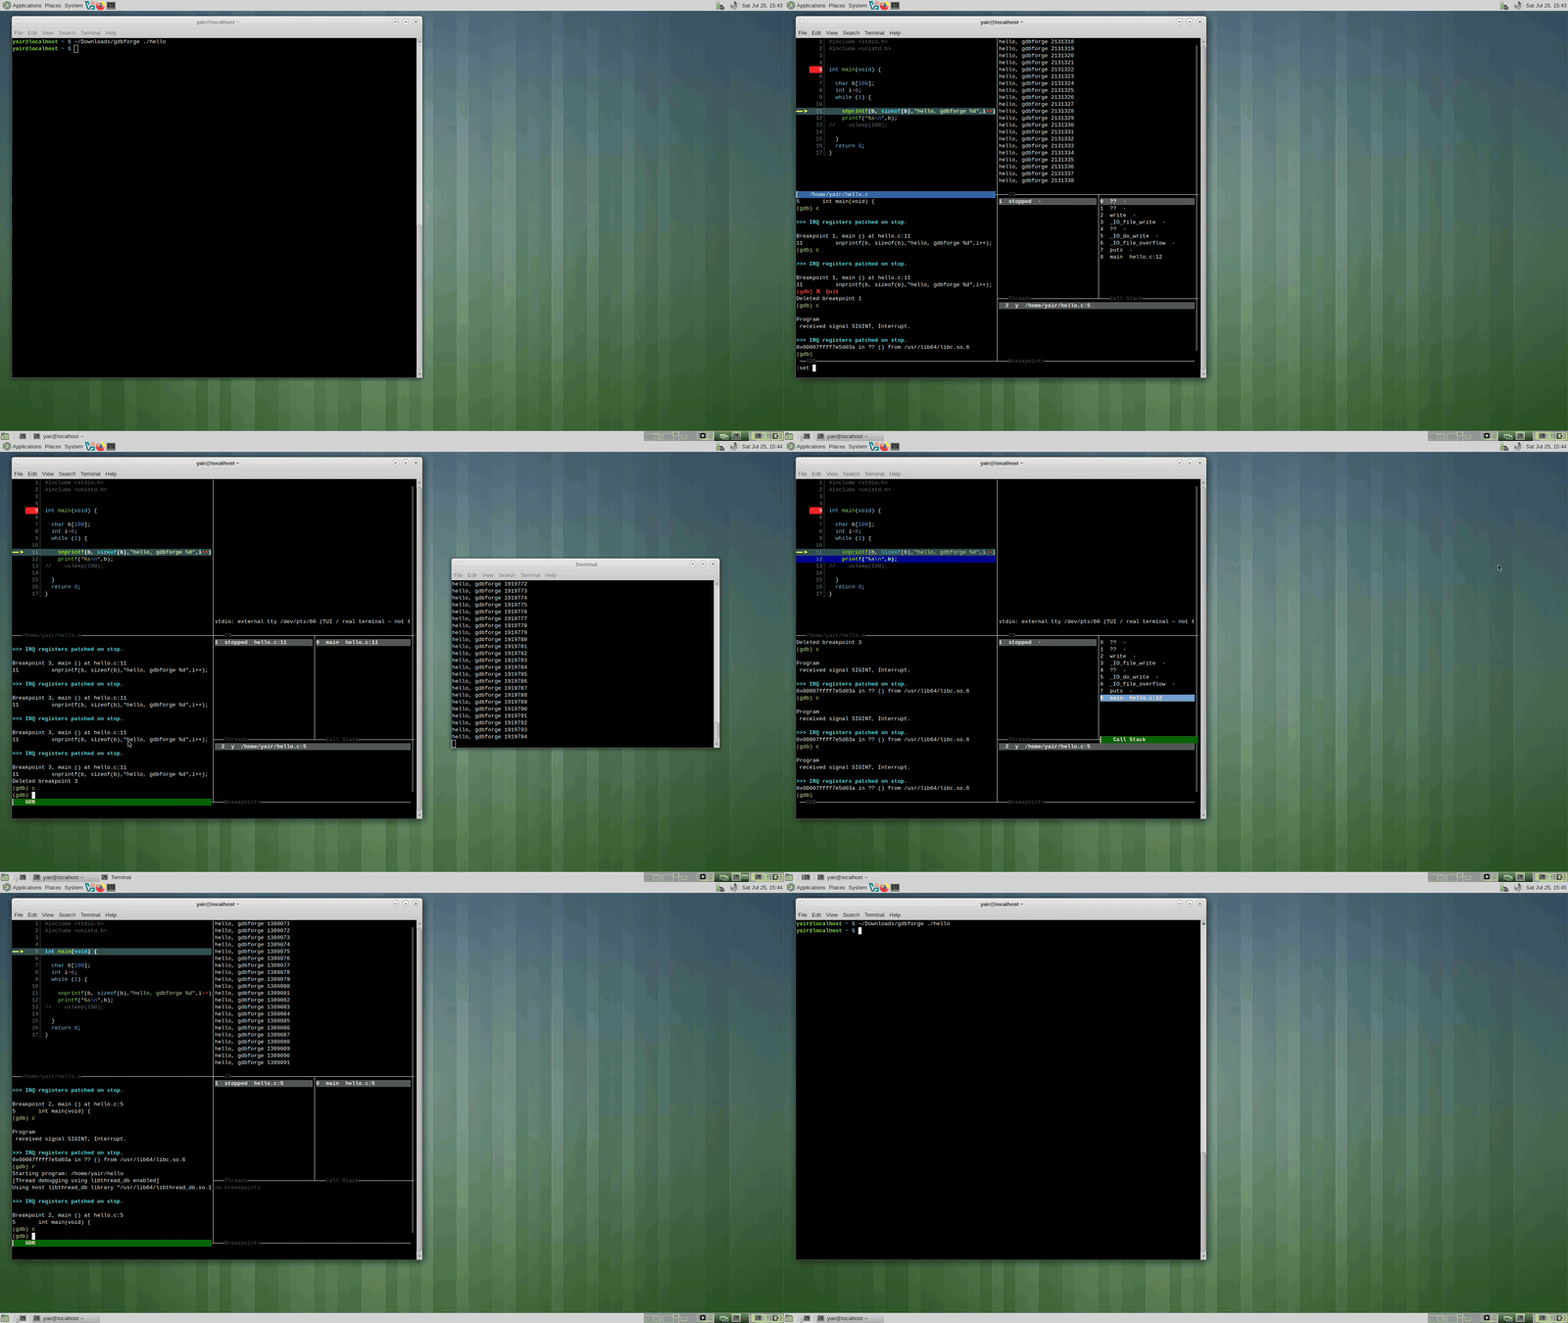
Program I/O — internal pane versus external terminal. The same program run two ways:
once with its stdout in the built-in :b io pane, and once attached to a real terminal
emulator, which is what full-screen curses programs need.
Watch on YouTube ·
Linux application guide
Linux kernel and modules
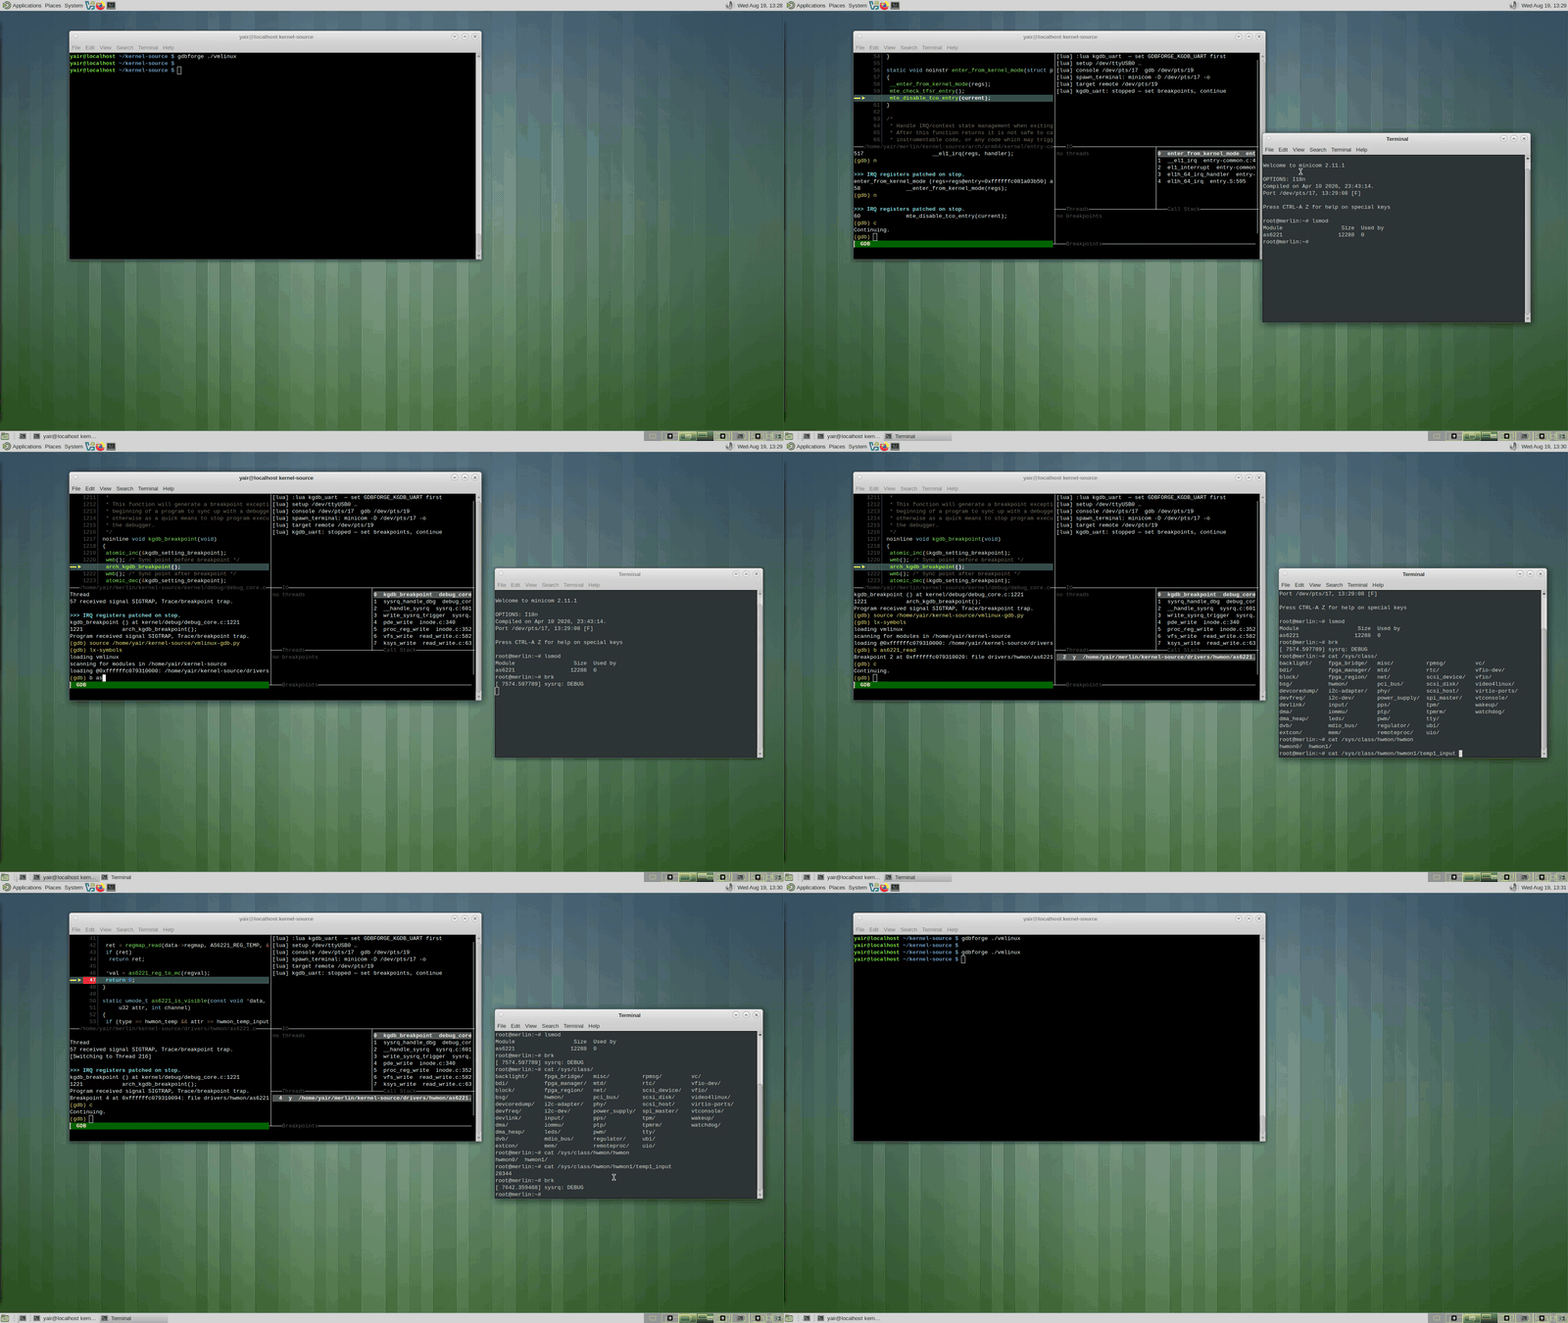
Kernel kgdb over a single UART. :lua kgdb_uart configures kgdboc, starts kdmx to
split the one serial line into a console PTY and a gdb PTY, opens minicom on the console,
and breaks into kgdb in about two seconds. Then lx-symbols, a breakpoint on a driver's
read path, and cat /dev/… from the console to hit it.
Watch on YouTube ·
Kernel and kgdb guide
Kernel kgdb with two UARTs. When the board has a separate console and kgdb cable there is no mux and no bring-up script — the simplest and most reliable kgdb setup. Watch on YouTube · Kernel guide — two UARTs
Go and Delve
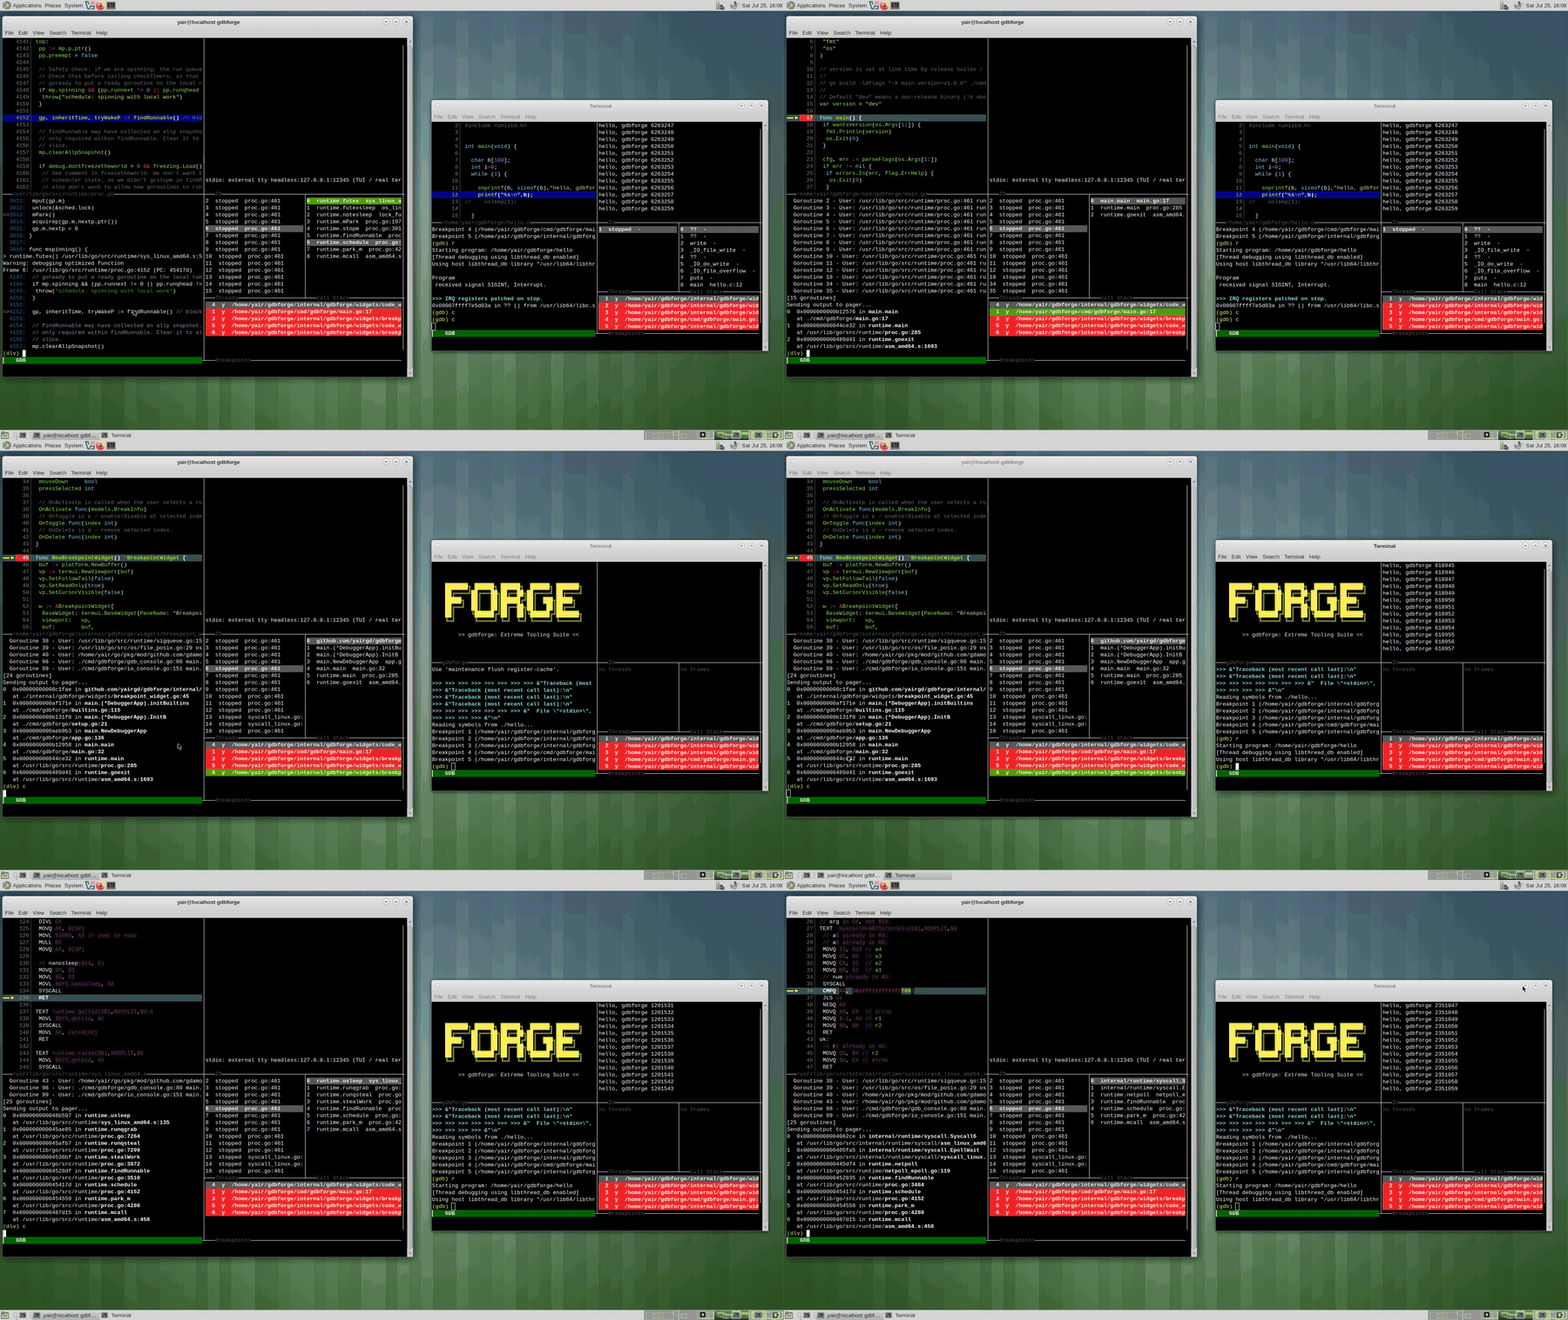
gdbforge debugging itself. A gdbforge process attached to another live gdbforge
session through Delve (-g dlv), stepping its own Go code — the same panes and keys as
under GDB.
Watch on YouTube ·
Delve backend details
Project status
gdbforge is released and versioned — see the releases page and the changelog. The debugging workflows on this page are used for real work, but the project is maintained by a small number of contributors and parts of it are still moving. A realistic summary:
| Area | State |
|---|---|
| GDB backend — MI2 on a dedicated channel, console, source sync, breakpoints, threads, call stack | Works; the most exercised path |
Delve backend (-g dlv) |
Works for everyday Go debugging, but is not a full peer of GDB: the assembly pane is disabled, and some commands differ (see user guide) |
Program I/O — :b io pane and external terminal |
Works |
Split tree, layouts, modes, : command line with completion, mouse |
Works (provided by termforge) |
Assembly pane (:layout <name> asm, :vs asm) |
Works under GDB only |
Breakpoint persistence (./.gdbforge/breakpoints.yaml) |
Works |
Lua workflow scripts and the gdbforge.* API |
Works — 25 gdbforge.*/pane.* functions and about 30 bundled workflow scripts, all embedded in the binary. The API is not versioned or frozen and may change between releases |
| Tabs | One tab only — no tab bar, no :tabnew |
| Register and memory panes | Not implemented — use :gdb info registers and GDB's x in the console |
| Native OpenOCD backend (telnet/TCL) | Not implemented — OpenOCD is launched as an external GDB server by the Lua scripts |
Planned work and known gaps: roadmap.
Documentation
Using gdbforge
| Page | What is in it |
|---|---|
| User guide | The full manual — modes, keys, colon commands, layouts, panes. Twin of the in-app :help |
| FAQ | Comparisons with cgdb and the GDB TUI, program I/O, supported targets and probes, Go/Delve |
| Linux applications | :lua remotegdb over SSH, gdbserver, :b io versus an external terminal |
| Zynq MPSoC | Cortex-A53 and Cortex-R5, J-Link and OpenOCD workflows |
| STM32 and Zephyr | Nucleo F429ZI and STM32F405; ST-Link, J-Link, Zephyr and FreeRTOS profiles |
| Kernel and kgdb | Two UARTs, one UART with kdmx, in-process mux, Ethernet |
| Lua API | The gdbforge.* functions available to scripts |
| Plugins | How Lua scripts are discovered and loaded |
| Command system · Input · Window management · Exec shell | Command tree and completion, key handling, splits and tabs, :! panes |
| Changelog | What changed in each release |
Developing gdbforge
The architecture — the MVC split, controllers and host interfaces, the event bus, and the repository layout — is documented separately:
| Page | What is in it |
|---|---|
| Overview | Goals, motivation, and how gdbforge compares to cgdb and the GDB TUI |
| Architecture | Subsystems and data flow. Start with MVC, built on termforge, and the design principles |
| PTY architecture | Dual PTY master/slave, GDB versus Delve, :b io, external terminal |
| Debugger integration | GDB MI2, the unified backend.Backend, the Delve backend, :AI / GdbMcpService |
| Window management | The three-band root layout, split trees, tabs, command line |
| Directory structure | Repository layout and the responsibility of each package |
| Dependencies | Go modules and the import rules between the debugger and the framework |
| Developer guide | Onboarding, which files to read in what order, common pitfalls |
| Flow browser | Curated call trees (Tab completion, Ctrl-C, the stop pipeline) with links to source. Has its own search box, separate from this site's header search |
| Roadmap · Releasing · Hosting | Planned work, how releases are cut, how these docs are built |
The generic terminal UI machinery — the widget system, the rendering pipeline, and the split-tree engine — lives in termforge and is documented on its own site: UI architecture · rendering · window management.
Mermaid diagram sources live under
docs/diagrams/.
Reading these docs locally
Then open http://127.0.0.1:8765/. Details: Hosting.
Related project: termforge
gdbforge is the debugger. The terminal UI it runs on is a separate project, termforge — widgets, split-tree windows, tabs, colon commands with tab completion, key-sequence bindings, and the terminal emulator pane, with no debugger in it. termforge was extracted from gdbforge once that machinery stood on its own, so gdbforge is both its origin and its largest consumer. This repository is now the debugger only.
| Question | Site |
|---|---|
| How do I debug something with GDB, Delve, an embedded target, or kgdb? | This site |
How does a widget, split tree, or :command work in general? |
termforge documentation — UI architecture, window management, rendering |
| How do I build my own terminal app on the same framework? | termforge documentation |
| How does gdbforge drive GDB or Delve? | Debugger integration on this site |
Source: github.com/yairgd/termforge · how the split works: ARCHITECTURE.md — Built on termforge.
Related links
- Project README on GitHub
- Releases and prebuilt binaries
- CONTRIBUTING.md — contribution workflow
- Issue tracker